Tennis is a complex activity involving both aerobic and anaerobic metabolism1, in competitive players a point lasts less than 10 seconds on average2 (depending on the surface3) and the recovery between points is about 20 to 25 seconds.

The distance covered by a tennis player to perform a stroke is less than 2,5m in 80 percent of the cases.4 It is important to notice that approximately 70 percent of movements are performed side to side, less than 20 percent in a forward, linear direction and less than 8 percent in a backward, linear direction.2
Tennis movement patterns are highly situation-specific and are performed in reactive conditions.5

During one of our staff meeting, the head coach of the tennis department raised an interesting issue: many of our players used to lose more points when the inertia of the game made them run forward (linear) instead of side to side (lateral).
This issue made my S&C team members think about the potential causes and we realized that the large majority of our testing and subsequent training interventions were lateral-based. In addition to this, we started monitoring more accurately tennis training sessions (without GPS tracking, only pen and paper) and players used to perform more than 85 percent of their movements side to side on average (even more than the linear-lateral ratio of a tennis match2).
We understood that we were putting too much emphasis on lateral training at the expense of linear training.


As we came to this conclusion, we performed a performance analysis process on our players’ ability to accelerate forward. First of all, we collected basic data such as age and bodyweight, then we conducted various tests of which results could have given us more information for our following coaching interventions:
- 10m sprint test
This distance seemed to be the most important to evaluate, the length of a tennis court is 23,77m, which means that to cover half of it 10m acceleration is required.
Measuring sprint time on longer distances might be interesting but not helpful.
- 10m sprint video analysis
Is popularly known that optimal running technique impacts movement efficiency and subsequently sprint performance.12,13,14
- 1RM back squat
Several studies demonstrated the direct correlation between an athlete’s ability to move heavy loads (1RM) and sprint performance.7,8,9,10,11
- 10m sprint time with visual stimulus and tennis racket
- 10m sprint video analysis with visual stimulus and tennis racket
During tennis activity, every athletic movement is performed with a racket in one or two hands and the players reactively start to move in relation to visual stimuli5.
We though that evaluating sprint performance with these additional environmental factors would have been important, also comparing the results with traditional 10m sprint test could have been interesting.
10m sprint test & 10m sprint video analysis
Equipment:
- 2 x test administrators
- 2 x timing gates
- 1 x Measuring tape
- 1 x Stopwatch
- 4 x Marker cones
- 1 x Tablet Bluetooth-connected with timing gates
- 1 x Mobile phone
- 1 x Mobile phone stand holder
- 1 x Tennis ball
Procedure:
- Warm-up
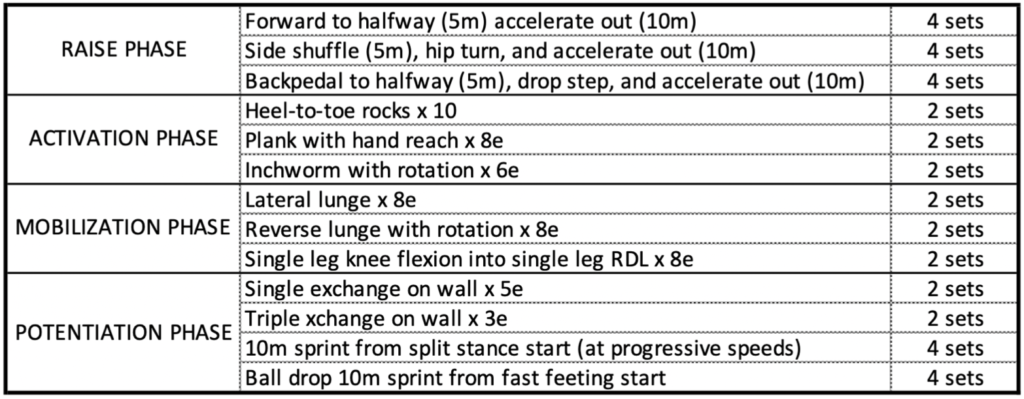
Our participants performed a standardized warm-up, the structure of the warm-up followed the RAMP system.15 After the warm-up players rested 5 minutes before starting the test.
- Test
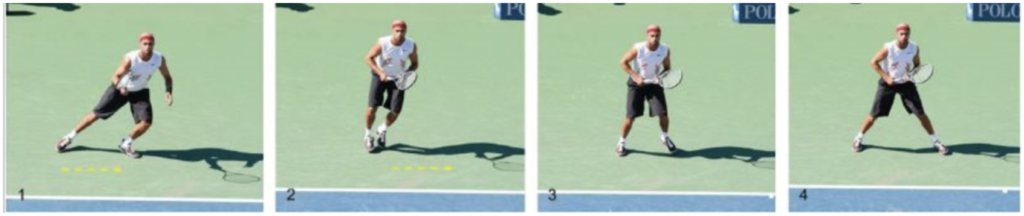
Players positioned themselves 0,30m before the first timing gate in a standing split stance starting position. We asked them to use always the same starting position to make the test more reliable.16
Timing gates had been previously set up with timing lights at 1m height, in order to meet most of every player hip height.17
One test administrator counted “3-2-1-GO!”, on the “GO” signal the player sprinted maximally to the second timing gate.
The other test administrator checked the time on the tablet associated with the timing gates and uploaded the result on the excel file.
Every player completed 3 tests, each separated by 3 minutes, in order to get complete phosphagen repletion.18
Every sprint has been video-recorded by a mobile previously set up on a mobile phone stand holder.
- Scoring
We calculated a mean score that provided an overall 10m sprint time:
Mean score (s)= (1° sprint time + 2° sprint time + 3° sprint time) / 3
1RM back squat
1RM testing is considered the “gold standard” for evaluating the strength levels of individuals in non-laboratory environments.19 It is defined as the maximal weight an individual can lift for only one repetition with correct technique. 1RM I test is often used by S&C coaches to assess strength capacities, strength imbalances and to evaluate effectiveness of training programs.20
As previously mentioned, several studies show how important 1RM back squat is for sprint performance.7,8,9,10,11
Equipment:
- 2 x Test administrators
- 1 x Power rack
- 1 x Olympic barbell
- 2 x 25kg Bumper plates
- 10 x 10kg Bumper plates
- 2 x 5kg Bumper plates
- 2 x 2,5kg Bumper plates
- 2 x 1,25kg Bumper plates
Procedure:
- Warm-up
Players performed 10 reps with a self-selected load that was approximately 40-50% of their 1RM, followed by 3 minutes rest.18
Players then selected a load based on the effort of the first set, which allowed them to complete 3 reps at approximately 80%1RM, also this set was followed by 3 minutes rest.18
- Test
After the warm-up, players selected a supposed 1RM load and began to attempt it with series of single repetitions until a 1RM load was found. After each single repetition every player rested 3 minutes.18
One test administrator acted as a spotter, the other one controlled the squat technique (femur had to go below parallel).21,21
10m sprint test with visual stimulus and tennis racket & 10m sprint video analysis with visual stimulus and tennis racket
We created this test to assess our players’ ability to accelerate in a more stressful environment.
The equipment, procedure and scoring were the same of 10m sprint test & 10m sprint video analysis, but we added 2 environmental factors:
- Reactive start: players had to sprint in relation to a visual stimulus instead of sprinting after the “3-2-1-GO!” command. The visual stimulus was represented by one test administrator that held a tennis ball in the hand and when he dropped it players had to sprint to the second timing gate.
- Tennis racket: during this test, players had to held in one hand their own tennis racket.
RESULTS:


1RM BS (kg): 1 RM back squat.
Relative 1RM BS: 1RM back squat compared to bodyweight.8
Environmental deficit (%): the decrement, expressed in percentage, between the mean score of 10m sprint time and 10m sprint time with the tennis racket and reactive start.
Studies suggest that ground contact time and ground force application are two key-factors that impact 10m sprint time.12,23,24 It would be interesting to measure them on our players, but unfortunately, we did not have a valid and reliable testing equipment.
DATA ANALYSIS AND DISCUSSION:
Along with the tests we did, we had enough tools to triangulate our findings in order to facilitate our decision-making process for the problem we faced.
When evaluating technique, we considered 45° forward lean posture (that relates to horizontal force production) as the most important technical component that could influence 10m sprint time.13,25,14,25,26
Case 1: “Player 8”
This player had the best relative 1RM BS, he showed the 3rd best score of environmental deficit and his 10m sprint time was close to the mean score of the group. But if we analyze his acceleration technique, we can see how much environmental factors have an impact on his sport-specific sprint performance.

Case 2: “Player 2”
This player had the worst environmental deficit, his relative 1RM BS was not good if compared to most other players, but his 10m sprint time was better than the mean score of the group. His sprinting technique seems to be poor in a both closed and open environmental situations.

Case 3: “Player 1”
This player showed the best environmental deficit score, his relative 1RM BS score was the 4th of the group and his 10m sprint time was worse than most other players. His sprinting technique seems to be correct in both closed and open environmental situations.

Higher levels of agility and quickness in field sport athletes depend on different factors such as strength, power, speed, anthropometric variables, technique, information processing, decision making skills, anticipation, and arousal level.2
Based on the data we collected we confirmed what literature says, in fact we noticed that almost every player has different weaknesses.
Unfortunately, in our coaching context we do not have the chance to train each one of them individually, this is the reason why our future planning requires a multidimensional approach.
In order to enhance linear acceleration in tennis players coaches should implement different interventions in training programs, these interventions may be characterized by:
- Linear-based strength exercises (back squat, barbell hip thrust, Romanian deadlift, etc.).7
For example, based on the data we collected, “Player 1” would benefit from this intervention since he showed good running technique in both open and closed situations and 0,80% environmental deficit. He may benefit from pure strength work.
- Technical work of linear acceleration (forward lean posture, short ground contact times, horizontal force production, etc.). 12,13,25,14,25,26
For example, based on the data we collected, “Player 2” would benefit from this intervention since he scored a good 10m sprint time, but his sprinting technique was poor in both open and closed situations.
- Including sport-specific environmental factors (reactive-cognitive starts, tennis racket) when training linear acceleration.
For example, based on the data we collected, “Player 8” would benefit from this intervention since he showed the best relative 1RM BS and good 10m sprint time if compared to other participants, but his forward lean posture decremented by 16,32% when environmental factors took place.